
Content marketing trends may come and go, but one thing has stuck and that is that visual works. Humans are visual creatures, we may struggle to remember what we read, but are much more likely to recall what we see.
We also have increasingly short attention spans, with the information overload that is the internet today. An average user spends only 15 seconds on a web page so you haven’t got long to grab their attention and make them want to read on.
There’s no doubt the power that visual content has on the Internet. YouTube and Instagram are very successful visual websites, with YouTube the 3rd most visited site on the web and Instagram featuring about 80 million photos shared every day. Web content that includes images gets 650% more engagement than content that only includes text.
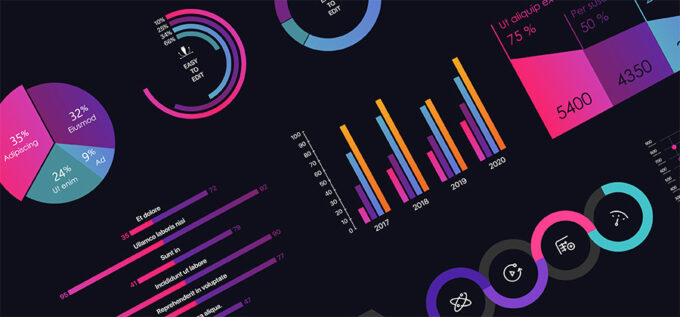
Infographics are a way of getting information across in a visual way. They might be diagrams, charts, or increasingly, animated visuals. They are graphic visual representations of information, data, or knowledge intended to present information quickly and clearly.
Any digital marketer wants their content to be shared, and going viral is the ultimate goal, though rarely achieved. Infographics are liked and shared more than any other type of content on social media, so including infographics in your content can add value.
Why are infographics used?
Source: adobe.com
Infographics are useful to explain complex information. This may be to:
- Give an overview of a topic
- Explain a complicated process
- Visually display research findings
- Summarise a report
- Compare different variables
They enable you to put information across in a way that makes it easier to understand than words alone. The brain processes visual information 60 times faster than written information.
Using an infographic to explain your product or service will add value for customers and make it easier for them to understand. This will help with customer satisfaction and retention.
What makes a good infographic?

Source: pexels.com
A good infographic should tell a story, present new or previously undiscovered information or show a new angle or fresh perspective on common knowledge. It should be compelling, both the information and the visual design. The key message should come across from looking at it for a few seconds, but it should also educate you if you look at it for a minute or two.
A good infographic should be easy to understand and not confuse. It should tell a meaningful story in an instant and should be easy to skim read. A clean, uncluttered design should allow the key elements to stand out and communicate the main points clearly.
But in content marketing today, everyone is using infographics, so how can you make an infographic that stands out and grabs attention?
Think about your target audience
It’s tempting to just include an infographic that is on a popular subject. But the key to creating a great infographic is to aim it at your target audience. Think about who your audience is and what they want to see and create an infographic based on this.
1. Keep it simple
One of the purposes of infographics is to represent complex ideas in a simple, visual form. But some can become so overloaded with information that they lose this purpose and instead create confusion.
The best infographics are simple and clear. They should allow the viewer to understand the subject matter more easily.
2. Keep it focused
As well as simple, a good infographic should focus on one topic. Don’t be tempted to shove as much information as you can into it, it will then be complicated and confused. Instead focus on a single topic.
3. Make it visually appealing
A good infographic needs to look appealing to draw attention. It shouldn’t contain reams of text, keep it simple with just the few key points. Make sure there is plenty of white space so it doesn’t look too cluttered.
4. Make sure it is easy to read
Sometimes when infographics get resized to fit a web page they lose readability. Make sure the text on the infographic is big enough to read, if it is too small no one will bother with it.
5. Make sure it’s not too big
Although it needs to be readable, you don’t want it to be too big or you will lose readers’ attention. Some may also be on a slow connection so keep the size of the infographic to 1.5 MB.
6. Give it an attention-grabbing headline
The headline should describe the infographic succinctly and attract attention. Keep it brief – around 70 characters.
7. Double check the facts
Make sure the data you are presenting is accurate and up-to-date otherwise your infographic won’t be taken seriously. Cite the sources of the data at the bottom of it.
How to create an infographic

Source: pexels.com
There are plenty of free templates online to enable you to create a visually appealing infographic, like this one from Canva. However, for a really polished result you can use a graphic designer like Koreti to produce the ultimate infographic.
So are infographics the future of content marketing? There is no doubt that including imagery within your content makes it more appealing and likely to be read. Infographics are more likely to be remembered and also more likely to be shared.
The holy grail of content marketing is going viral, an infographic stands a better chance of doing this than reams of text. Infographics put information across in a way that is much easier to digest than text.
However, with everyone creating infographics now, you need to be clever with it to stand out. Paying attention to the visual aspect, content, size and focus will help you create an infographic that adds value to your content.


