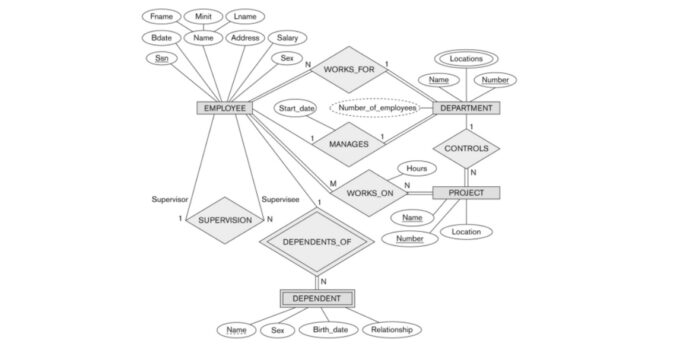
An entity-relationship diagram, or simply ERD, is a graphical representation that illustrates relationships between people, places, concepts, events, and objects within a system. An ER diagram is essential for modeling the entire data stored in a database at any given time. At the same time, ER diagrams depict the relationship between the data, entities, and respective attributes.
Typically, an ER diagram is composed of three elements:
- Entities: Entities are represented by objects, events, concepts, or persons that contain system-related data.
- Attributes: They are referred to as the characteristics of any entity. In complex ER diagrams, an object can have more than one attribute.
- Relationship: A relationship illustrates how communication happens between two or more entities.
The entity-relationship diagram or model is a highly used flowchart type used in different domains, like business information systems, software engineering, education, research, logistics, supply chain management, and more. In order to work on complex ER diagrams, a project manager should understand ER diagram symbols and software, which lets them draw ER diagrams easily.
ER Diagram Symbols
A detailed ER diagram is a great way to understand how the entire set of data is stored in a database. In order to properly master an ER diagram and how it specifies what data an engineer will store, we need to first understand different ER diagram symbols.
Unlike other flowcharts, ER diagrams only contain three basic symbols, rectangles, ovals, and diamonds. Furthermore, there are different sub-elements that help in understanding entities and relationships in detail.
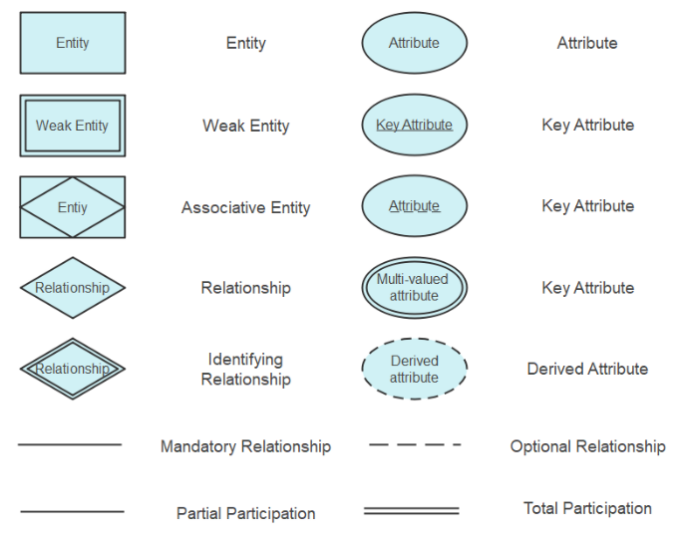
- Rectangles: They represent different entity types
- Ellipses: They represent attributes of entities
- Diamonds: In ER diagram, diamonds represent different relationship types between the entities and their attributes
- Lines: They link different attributes to entity types. In complex ER diagrams, lines also link different entity types with different relationship types.
- Primary Key: They represent underlined attributes
- Double Ellipses: In ER diagram, they represent multi-value attributes of any database modeling
- Derived Attributes: They are denoted via a dotted eclipse and represent those attributes whose value can be analyzed and evaluated from related attribute values.
- Associative Entity: They relate the instances of multiple entity types.
How to Draw an ER Diagram Effortlessly?
After learning about the ER diagram symbols, let us now understand the easiest way to draw an ER diagram. EdrawMax is a powerful diagramming tool that helps in creating ER diagrams effortlessly. Simply follow the steps mentioned, and a detailed ER diagram will be ready in a few minutes.
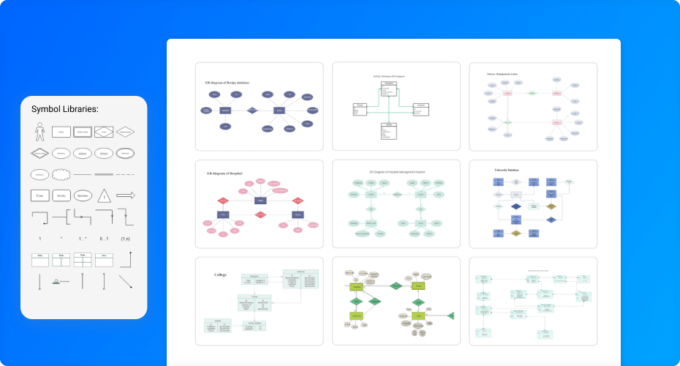
- Launch & Register: With the help of er diagram software, you can create an er diagram more easily. Once you are in the system, you will see different diagram types and associated pre-built templates for you to access.
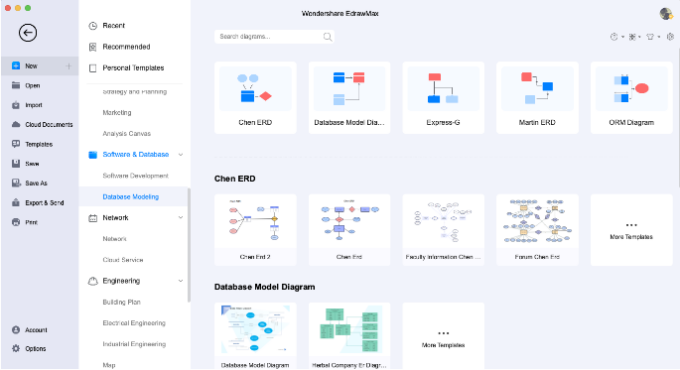
- Choose Template: In the diagram panel, head to ‘Software & Database’ and click on ‘Database Modeling.’ It will open different categories of database modeling diagrams, like Chen ERD, Database Model Diagram, Express-G, Martin ERD, and ORM Diagram. Click on the one that resonates with your requirement or head to the ‘Template’ community and look for an ER diagram to access user-generated diagrams.
![]()
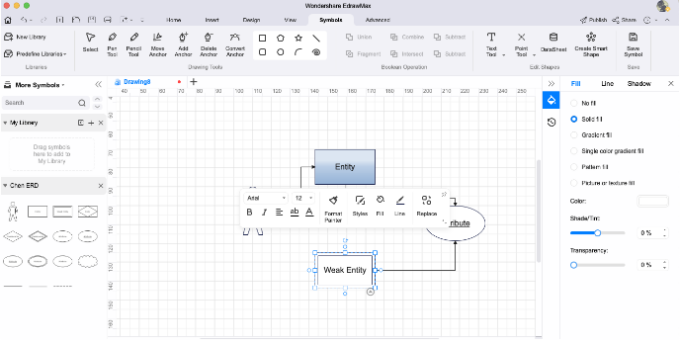
- Start from Blank: If you have expertise in creating ER diagrams, click on ‘+’ and start making the ER diagram from scratch. You can use in-built ER diagram symbols and change the labels or legends as per the requirements.
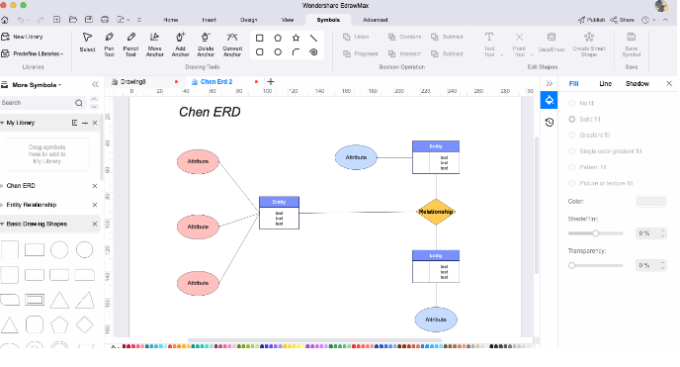
- Add Elements: It comes with vector-enabled elements, like Entity, Relationship, View, Attribute, Derived Attribute, Constraints, and more. Add these ER symbols to your diagrams and customize them using the graphics option.
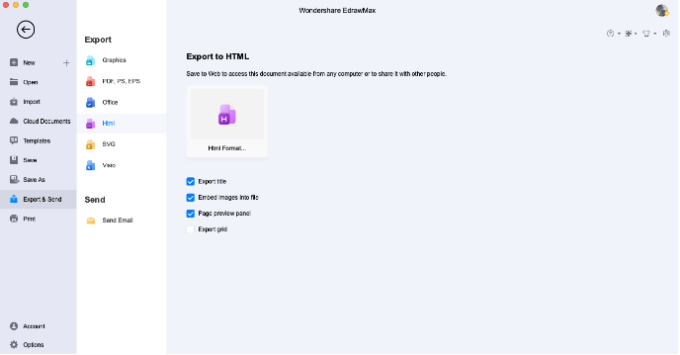
- Export & Share: Once the ER diagram is completed, you can share it in different formats, like JPEG, HTML, PNG, and more. You can also publish your ER diagram to the template community or share them online on different social media platforms, like Facebook, Twitter, Line, and more.
Other Helps for Drawing ER Diagram
Drawing an ER diagram becomes easier with a software because of the pre-built templates and access to symbols. There are several other amazing features of this free ER diagram software that makes it the best diagramming software, like:
- Built-in templates: With a user-generated template community where one can find templates ranging from flowcharts, ER diagrams, Swimlane diagrams, and more. As a registered user of this free ER diagram software, one can publish their ER diagram templates and inspire others. In addition, these free ER diagram templates are 100 percent customizable.
- Industry-standard symbols: This free ER diagram software comes with 26,000+ vector-enabled symbols that help create 280+ diagrams. All the ER diagram symbols are created by professionals and are factually correct. One can also create symbols by using the Pen and Pencil tool.
- Connectivity Tools: Any ER diagram is incomplete without the addition of the right connectivity tools. From relationship, parent to a category, category to the child, dynamic connector, line connector, partial, weak line, participation, etc., you will find all the required connectivity symbols you can use. In addition to the symbols, this free ER diagram software offers many other features that help create ER diagrams for any database.
- Export as you wish: Once the entity relationship diagram is designed as per the database’s requirement, a project manager can export the modeling diagram in multiple formats, like Graphics, PDF, PS, EPS, HTML, SVS, Visio, and more.
Final Thoughts
An entity relationship diagram, or ERD, is a great way to model complex databases. However, shapes and notations can be a little daunting for a student or a beginner. In such cases, it is recommended to go ahead with free ER diagram software. With the help of online resources, a project manager can easily model simple or complex databases. This free ER diagram software also comes with the ability to remotely access files or collaborate with team members, ensuring that the virtual team can easily collaborate on different projects.


