People have been inhabiting this planet, Earth, for millions of years, with modifications and growth happening at a suitable pace to get us where we are today. And this process led to the discovery and invention of various other things along the way, one such main thing being people learning how to earn their survival and livelihoods.
With the passing years and centuries, people realized and understood that not everything on this planet is free of cost, and everything needs to be worked for to earn their survival. And then slowly came the introduction of the system where people learned to pay for what they wanted, be it either in metal money like iron, gold, silver, etc., or through other means of payment involving non-monetary transactions. And all this led to the development of activities, trade, and commerce right since our ancestral days, the same being highly developed and having an enormous industry today.
Indicator trading
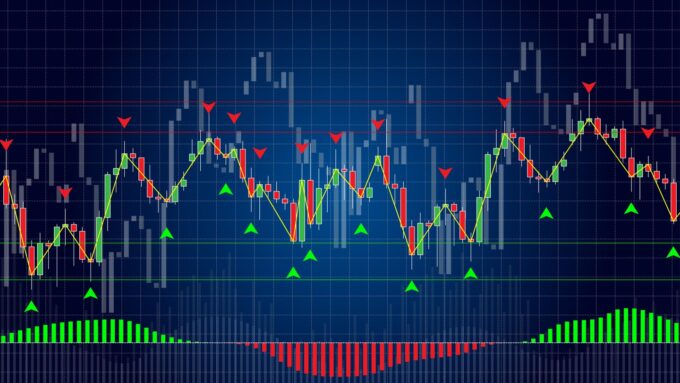
Source: admiralmarkets.com
“Trading” commonly means exchanging goods and services for something in return. This can be of two types which include-
- Using of money or currency directly, like cash or cheque, to pay for the commodities so purchased
- The use of a barter system involves exchanging goods or services among parties in return for a good or service of their choice offered by the other party. This eliminates the use of money directly and believes in evaluating the worth of the commodities.
In the business industry, trade explicitly means purchasing and selling marketable securities and other assets to profit from these transactions. It involves the vigorous participation of a person in the financial markets to keep track of the varying trends and understand the markets so that they know when is the right time to buy or sell their securities. A person who engages in this short-term activity of the markets is called a trader, and they are required to be quick on their feet as trades keep varying each second.
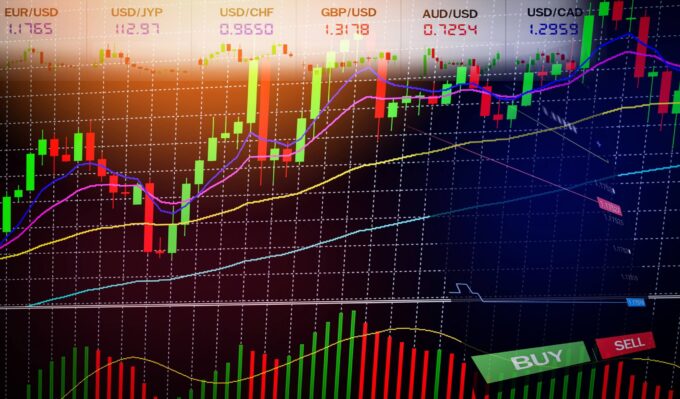
As simple as it may sound, trading on the stock markets requires specific skills and adequate knowledge of various factors so that an informed and wise choice can be made to make a profit turnover in higher margins. This can be done in broadly five ways being:
- Scalping- Aims at making small profits multiple times on small price changes.
- Day trading– involves buying and selling securities the same day before the market closes, without dragging it overnight.
- Momentum trading focuses on stocks that move up or down in one direction and at a considerable volume.
- Swing trading- This captures the short-term trends and patterns of the market, that is, within 1 to 7 days.
- Position trading- Involves anticipation of how long the current trends may last and stays in trade for weeks and months.
Source: investmentu.com
No matter what type of trading is practiced, traders need specific essential tools and computations to help them analyze market situations. These can be done with the help of trade indicators.
Trading indicators are nothing but mathematical calculations and computations depicted in the form of lines on a price chart. The variations in these lines help the traders to know how well or poorly the markets are performing through the trends and signals it indicates. These are also of different types like-
- Moving average
- Exponential moving average
- Moving average convergence divergence
- Relative strength index
- Fibonacci retracement, etc
Although these indicators may be slightly challenging to understand at first, these go a long way in being a handy add-on tool for traders, giving rise to the next question, which is-
Do indicators work in trading?
Source: digitalvaluefeed.com
The answer honestly depends upon the trader them self. It is essential to understand the following related to indicators-
- They provide you with price information, not directions on what to do. So the trader must interpret these indicators correctly and use them smartly.
- One must understand what the price chart is conveying by questioning themselves related to the relation between the trend waves, whether the price is being pushed stronger by buyers and sellers, etc. Only then can they pick on the clues provided in the charts and work accordingly
- Since indicators transform the data on prices into a visual format, it helps a great deal by eliminating the time spent thinking about necessary price actions mid-decision-making, making the process quicker and easier.
So yes, indicators work wonders for traders who know how to use them correctly and not misinterpret them.
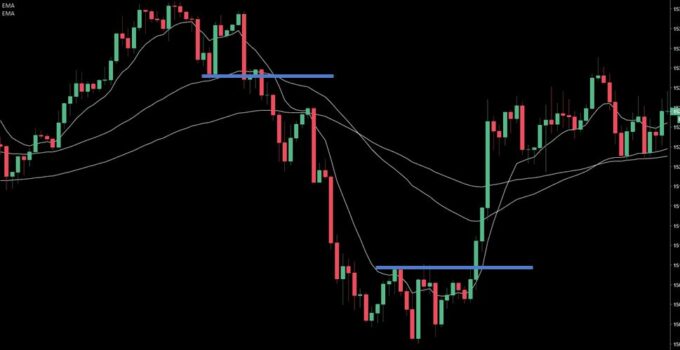
How do you read an indicator?
Source: thestreet.com
An indicator may be depicted on a line chart, a bar chart, or the most common candlestick chart. The lines and bars depict the price highs and lows and the open and close prices.
A candlestick’s hollow and colored region is called the body, with highs and lows displayed above and below it. When the body is green, it indicates a price increase, and when the body is red, it indicates a decrease. A hollow candlestick indicates when close price>open price suggesting to BUY. A colored candlestick indicates when close price<open price, suggesting to SELL.
Similarly, there are many other things to pick on while reading your indicators that come with practice and time so that the information you have is reliable enough to help you make a good decision.
If you are looking at TradingWolf, it is crucial to take your time in understanding the various indicators and choosing your mainstream one, and understanding what it is trying to convey. This will help you make accurate decisions in buying and selling securities, enabling you to have a profitable edge over the markets at ease!


